Help Center

Drill Down for KPI Reports

Drill Down for KPI Reports is a data governance feature that sets up drill down criteria for DQ (Data Quality) reports so that responsible users can explore the quality issues.

Key Term:
  • Taxonomy: a taxonomy is a scheme of classification used for an organization’s products.
Description:
  • Different levels can be maintained for the dashboard to dive in the report and get more enhanced review of the report.
  • A user or supplier can have a detailed view of all the products drilled down in the report that allows a user to explore the quality issues.
Related topics:
Application:
  • This feature helps the user or supplier to have an in-depth DQ report for all the products available.

  • A user or supplier can narrow down on the products with quality issues. This can be based on a Taxonomy or a Tag.

  • Example:

    A KPI for a fashion taxonomy is created, it can be drilled down to a sub-level of the fashion taxonomy, and then again, there can be another drill down based on a Color tag, by which the user can have a detailed report and then explore all the KPI.

How-to: Drill Down for KPI Reports

To do this, follow these steps:


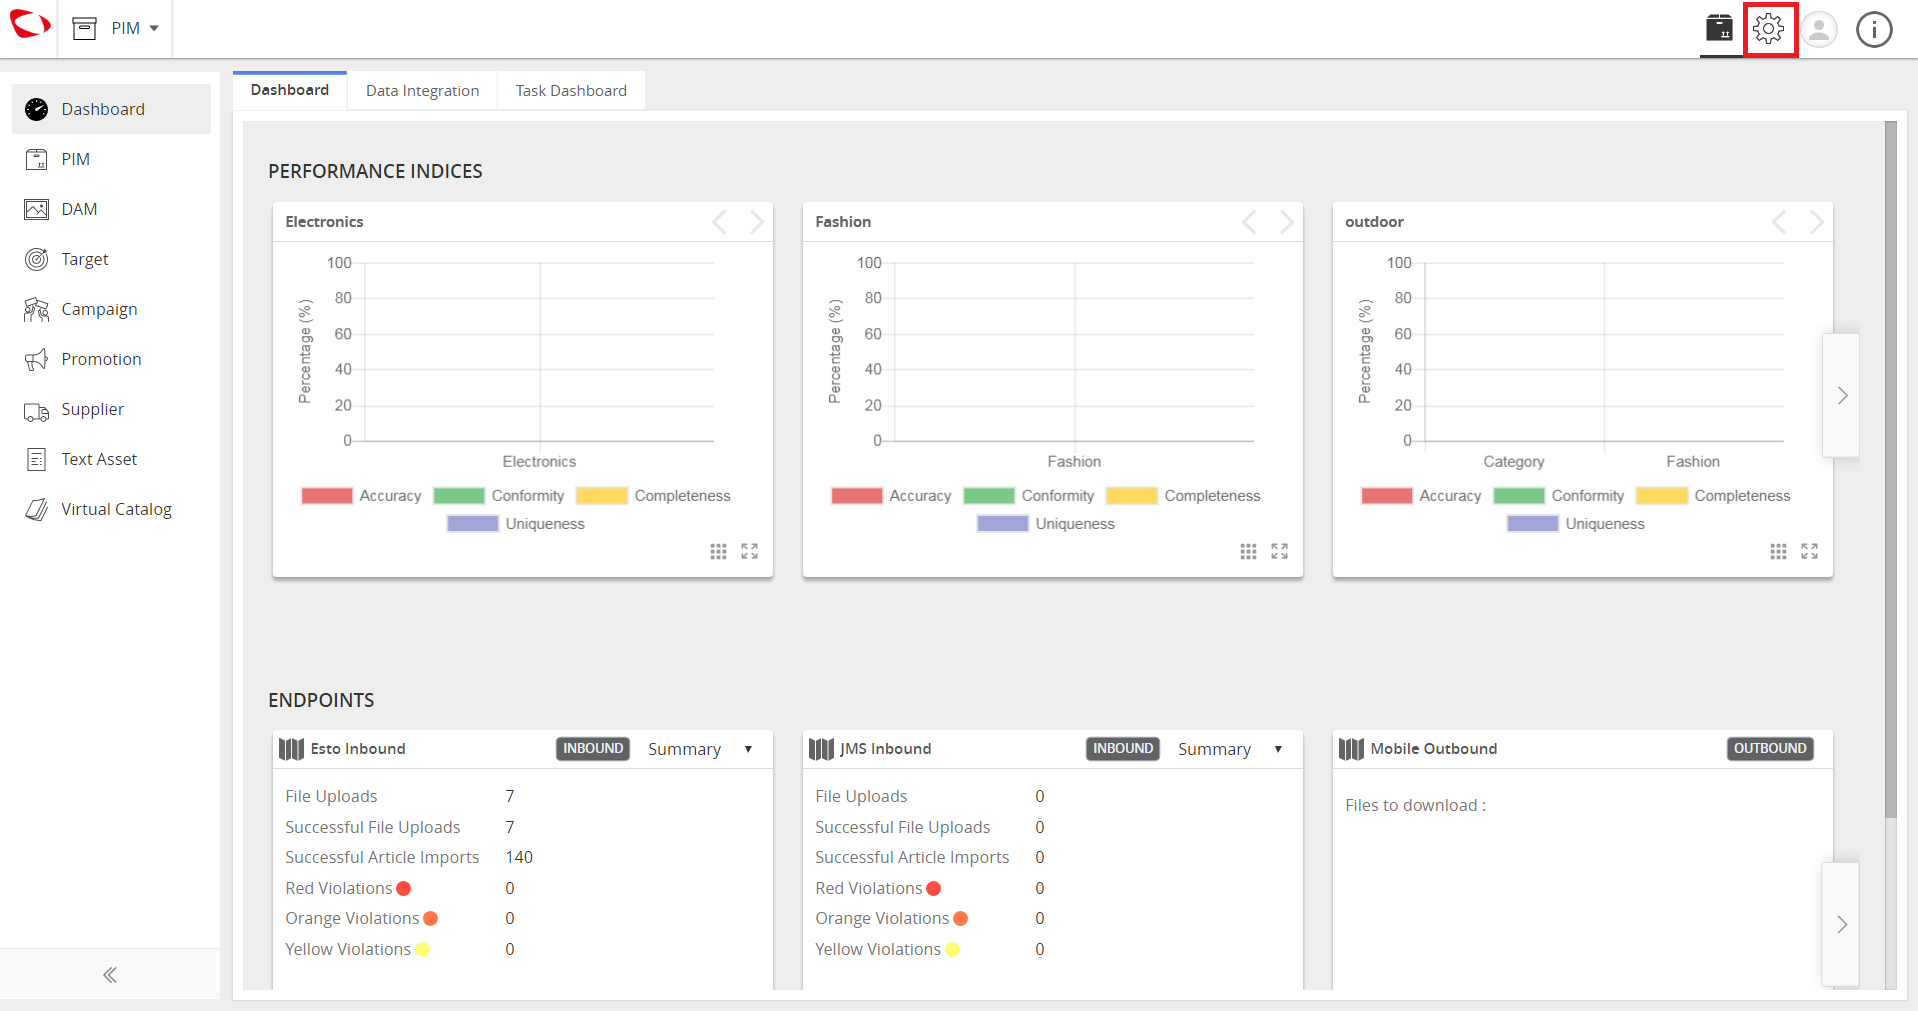
  1. Click Administration icon.
../../../../../_images/cs_drilldownforkpireports_gotoadmin.PNG


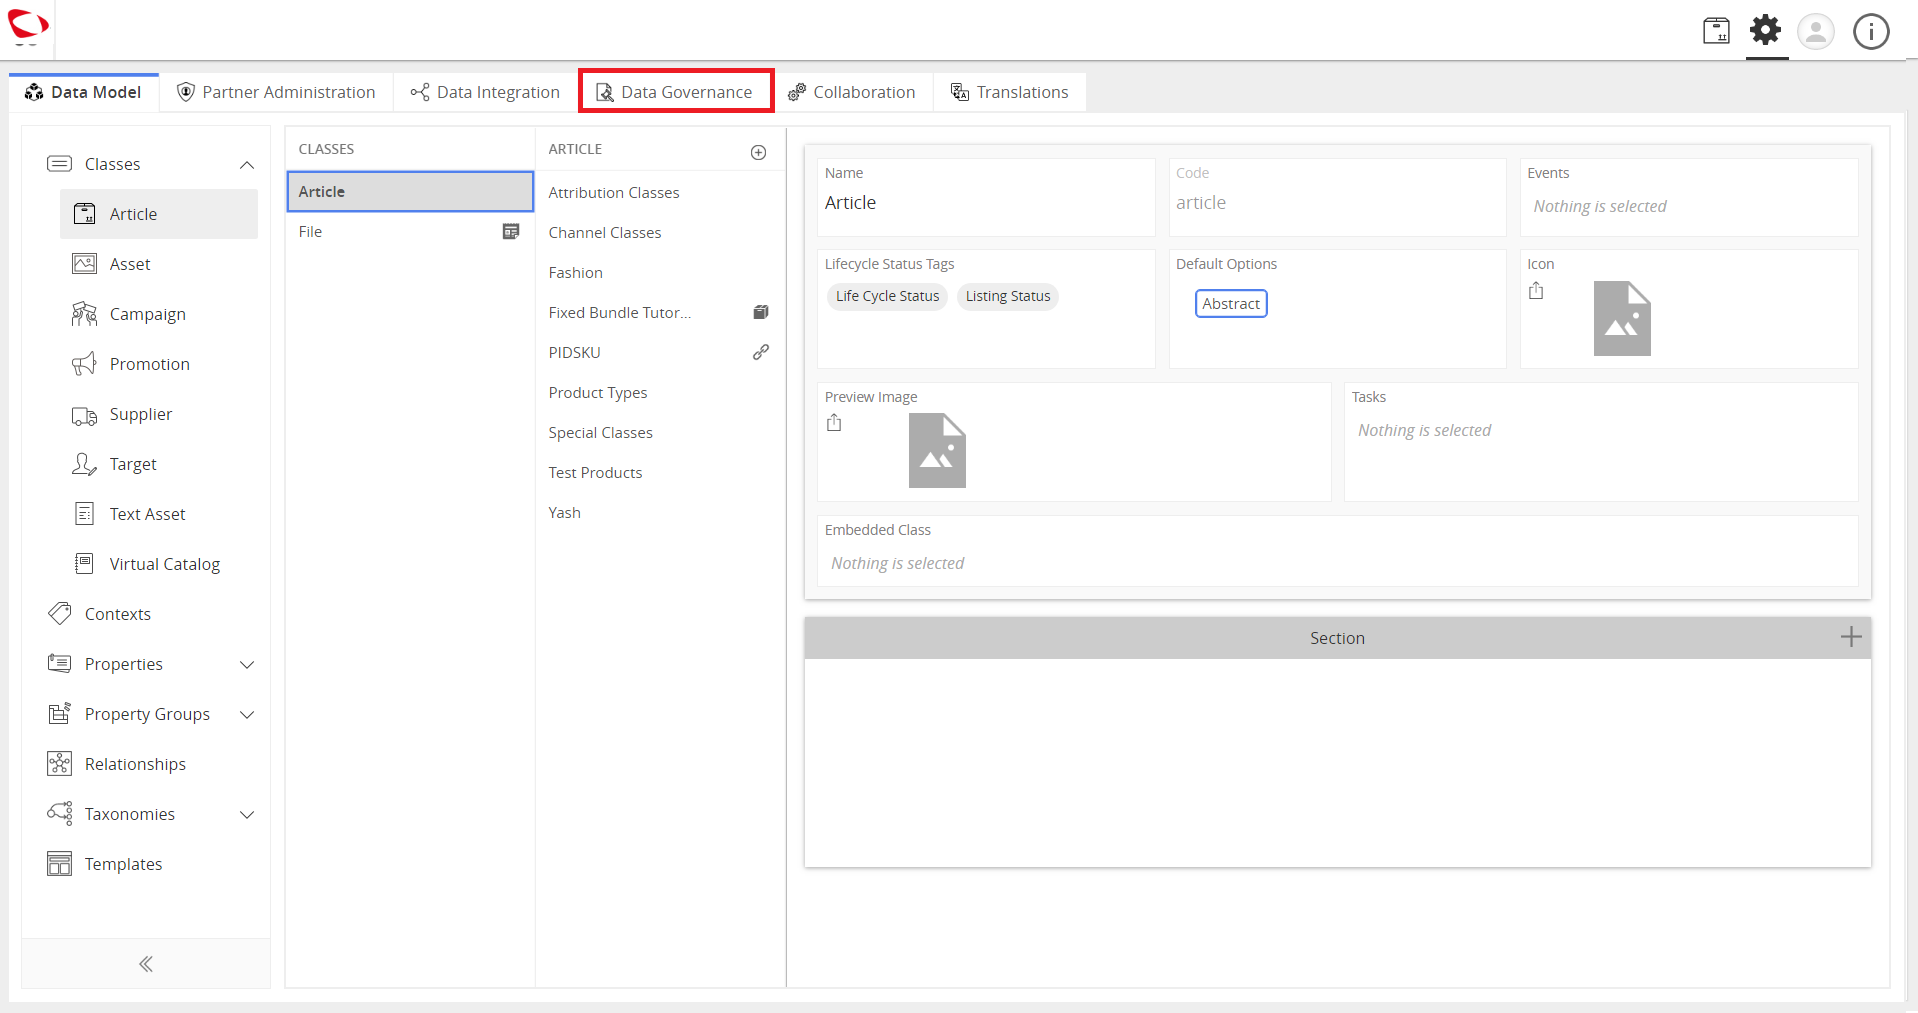
  1. Click Data Governance tab from the top.
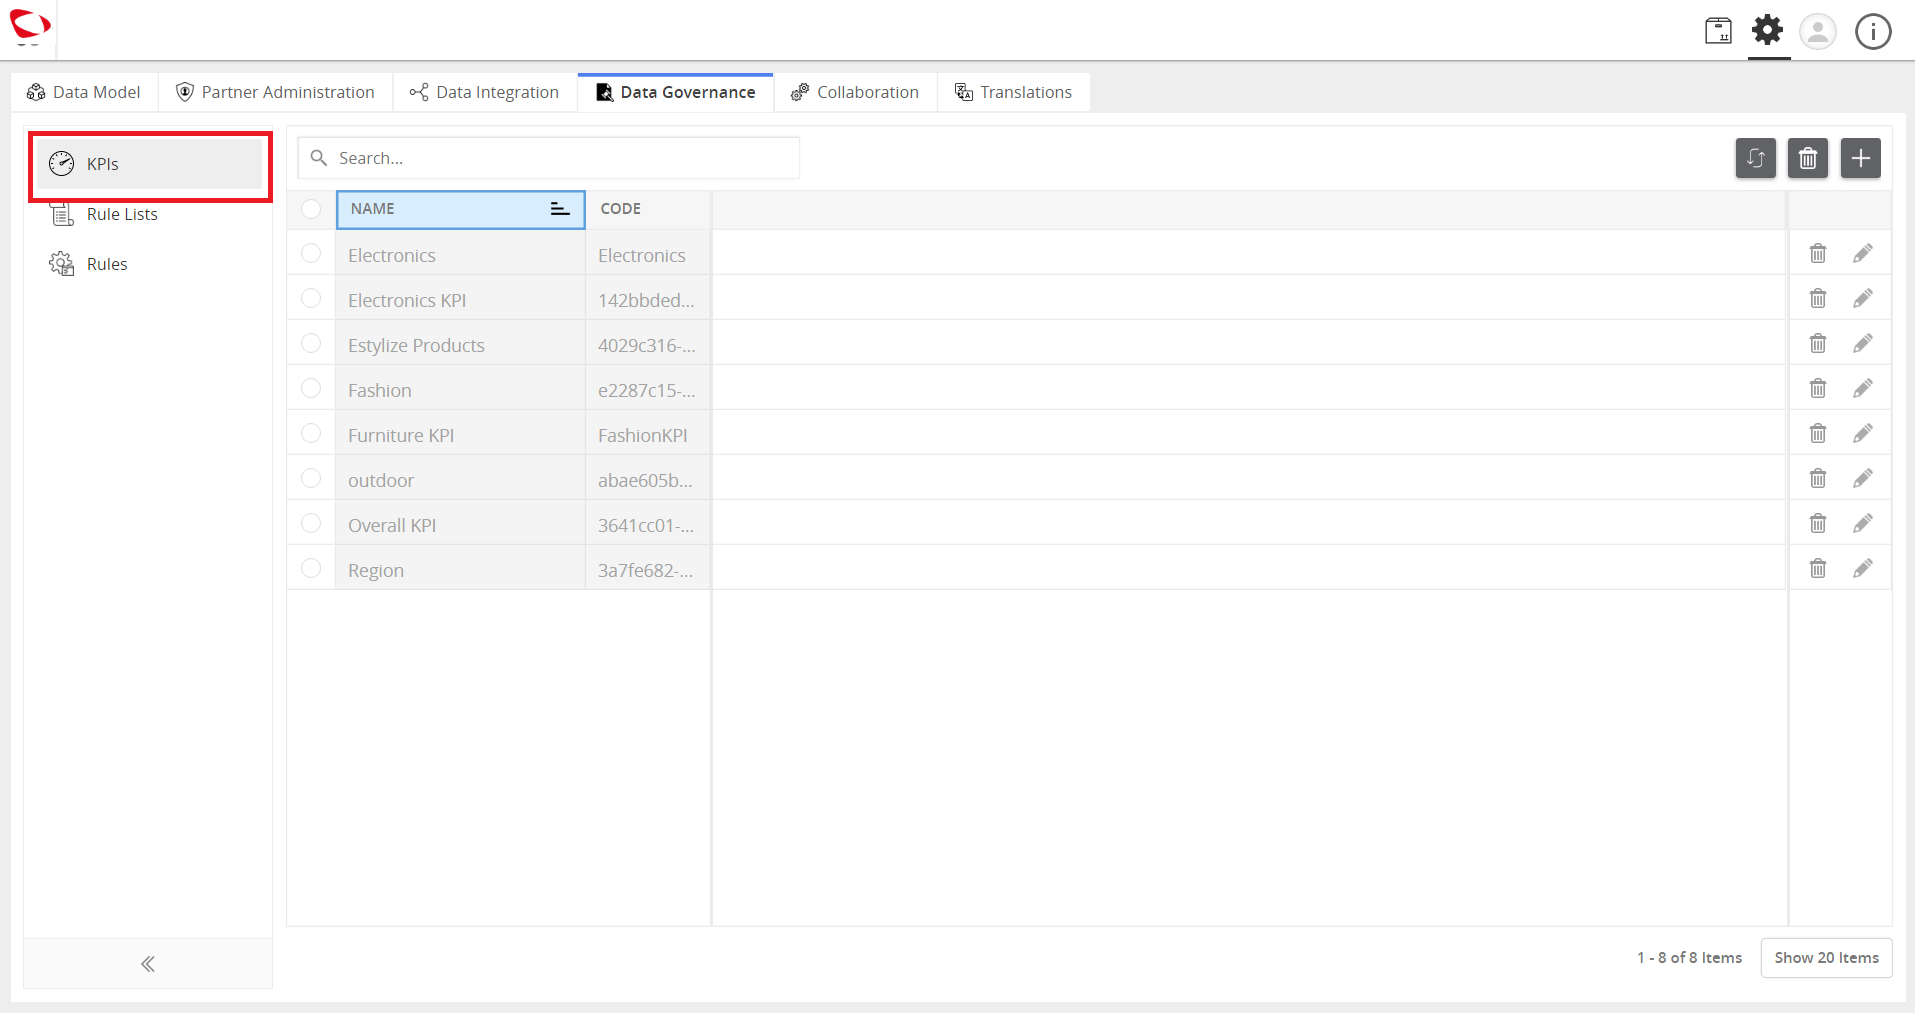
../../../../../_images/cs_drilldownforkpireports_clickdatagov.PNG


  1. Click KPIs.
../../../../../_images/cs_drilldownforkpireports_clickkpi.PNG


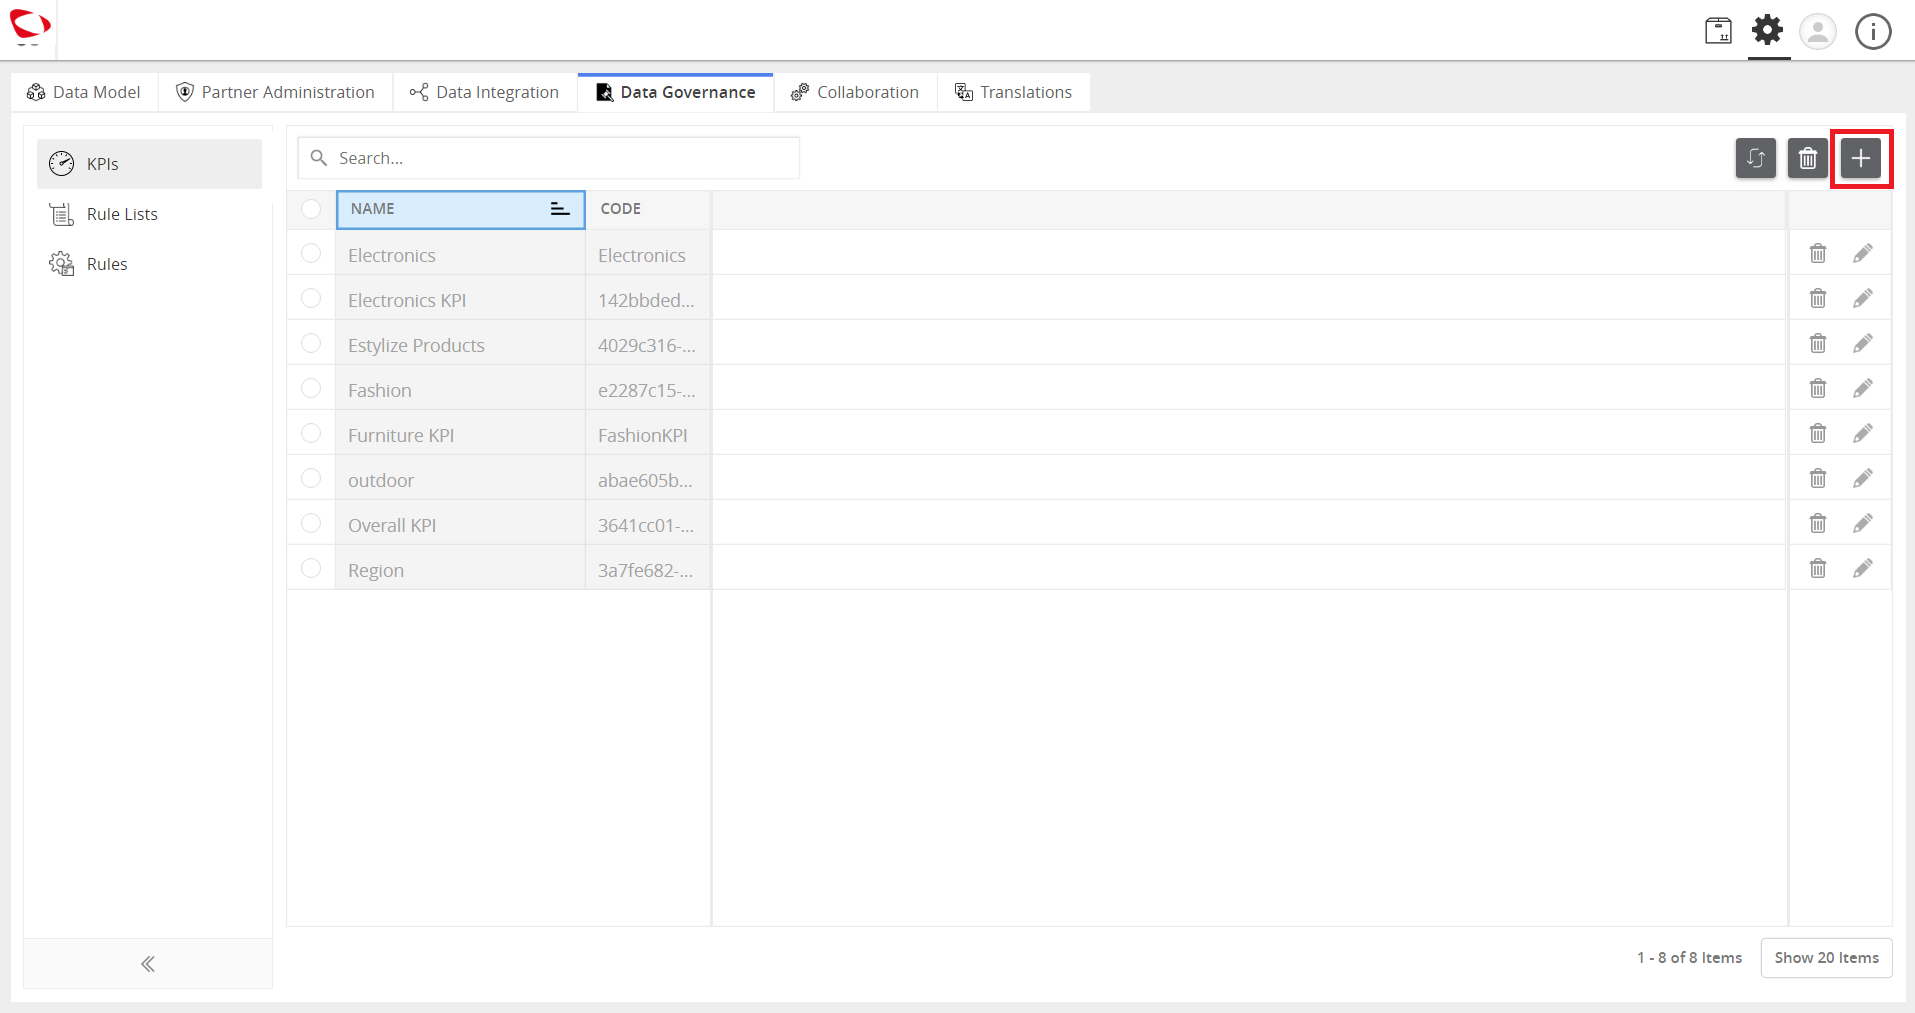
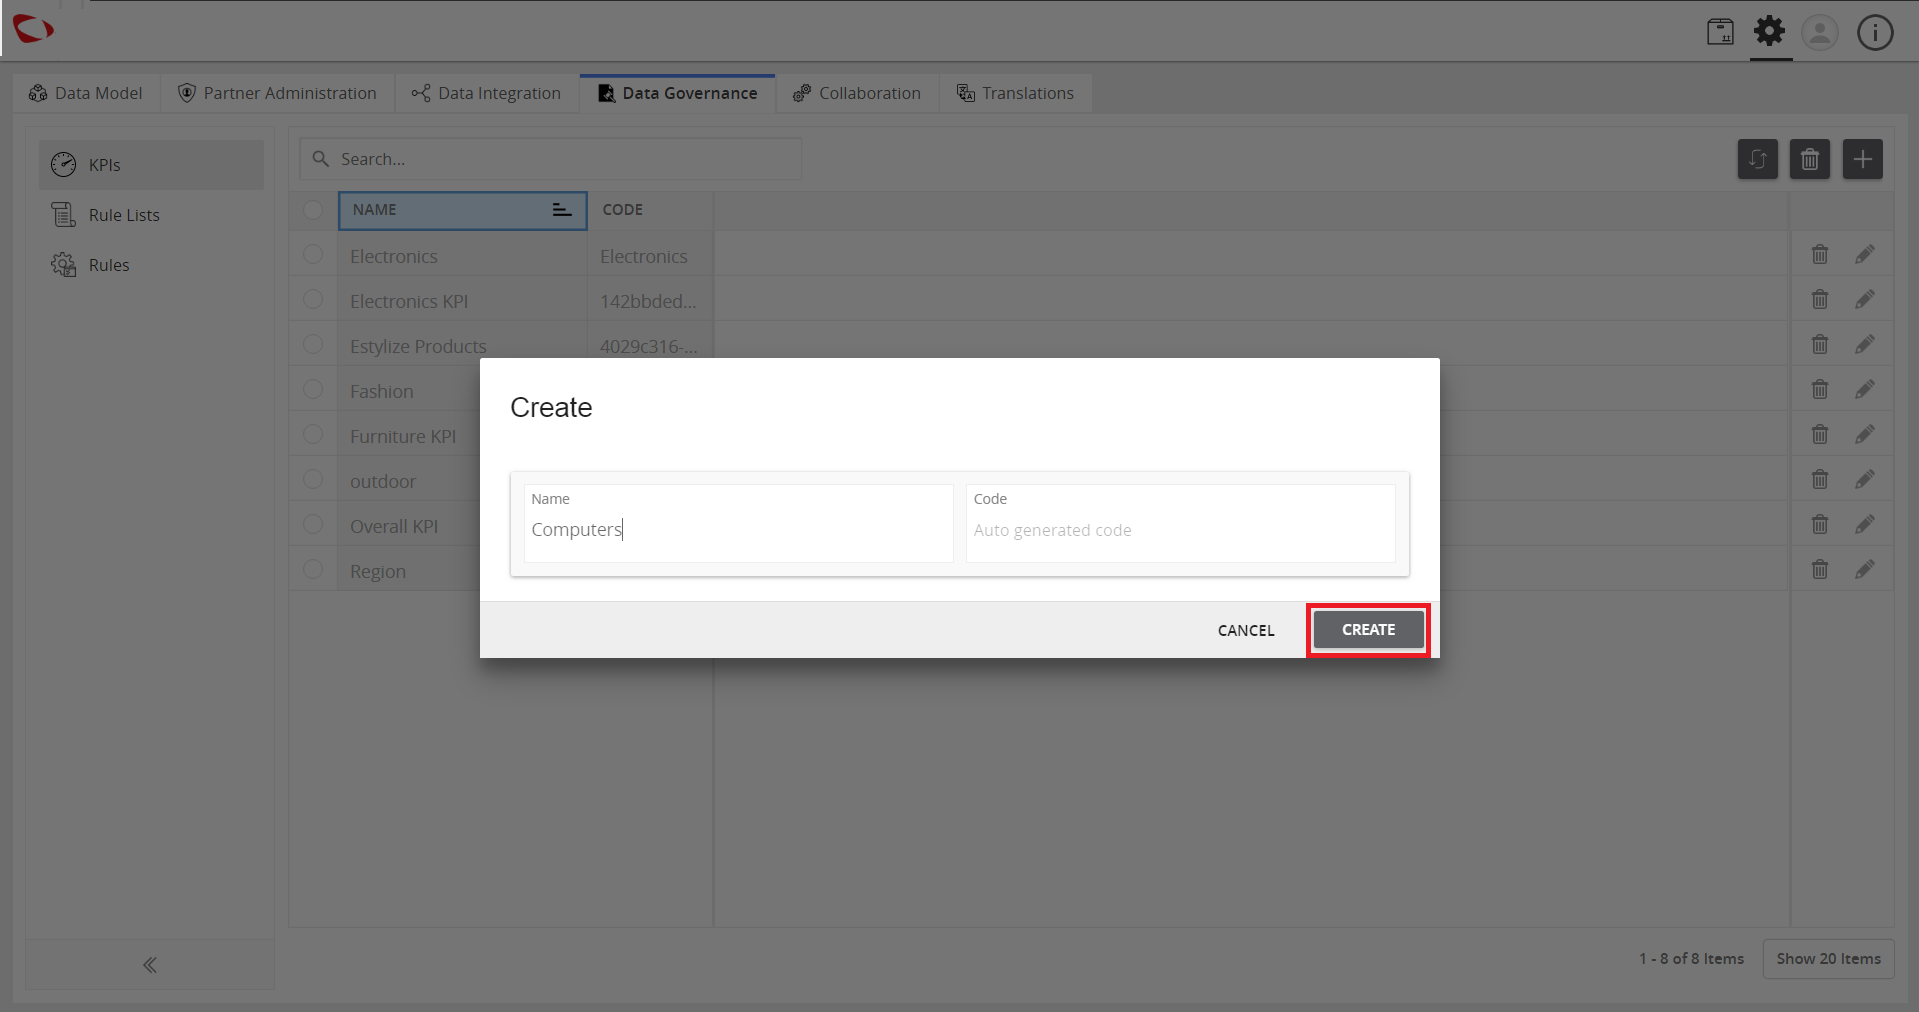
  1. Click the ‘+’ icon at the top right to create a new KPI.
../../../../../_images/cs_drilldownforkpireports_clickplus.PNG


  1. Enter a name and code(optional). Then, click CREATE to continue.
../../../../../_images/cs_drilldownforkpireports_entername.PNG


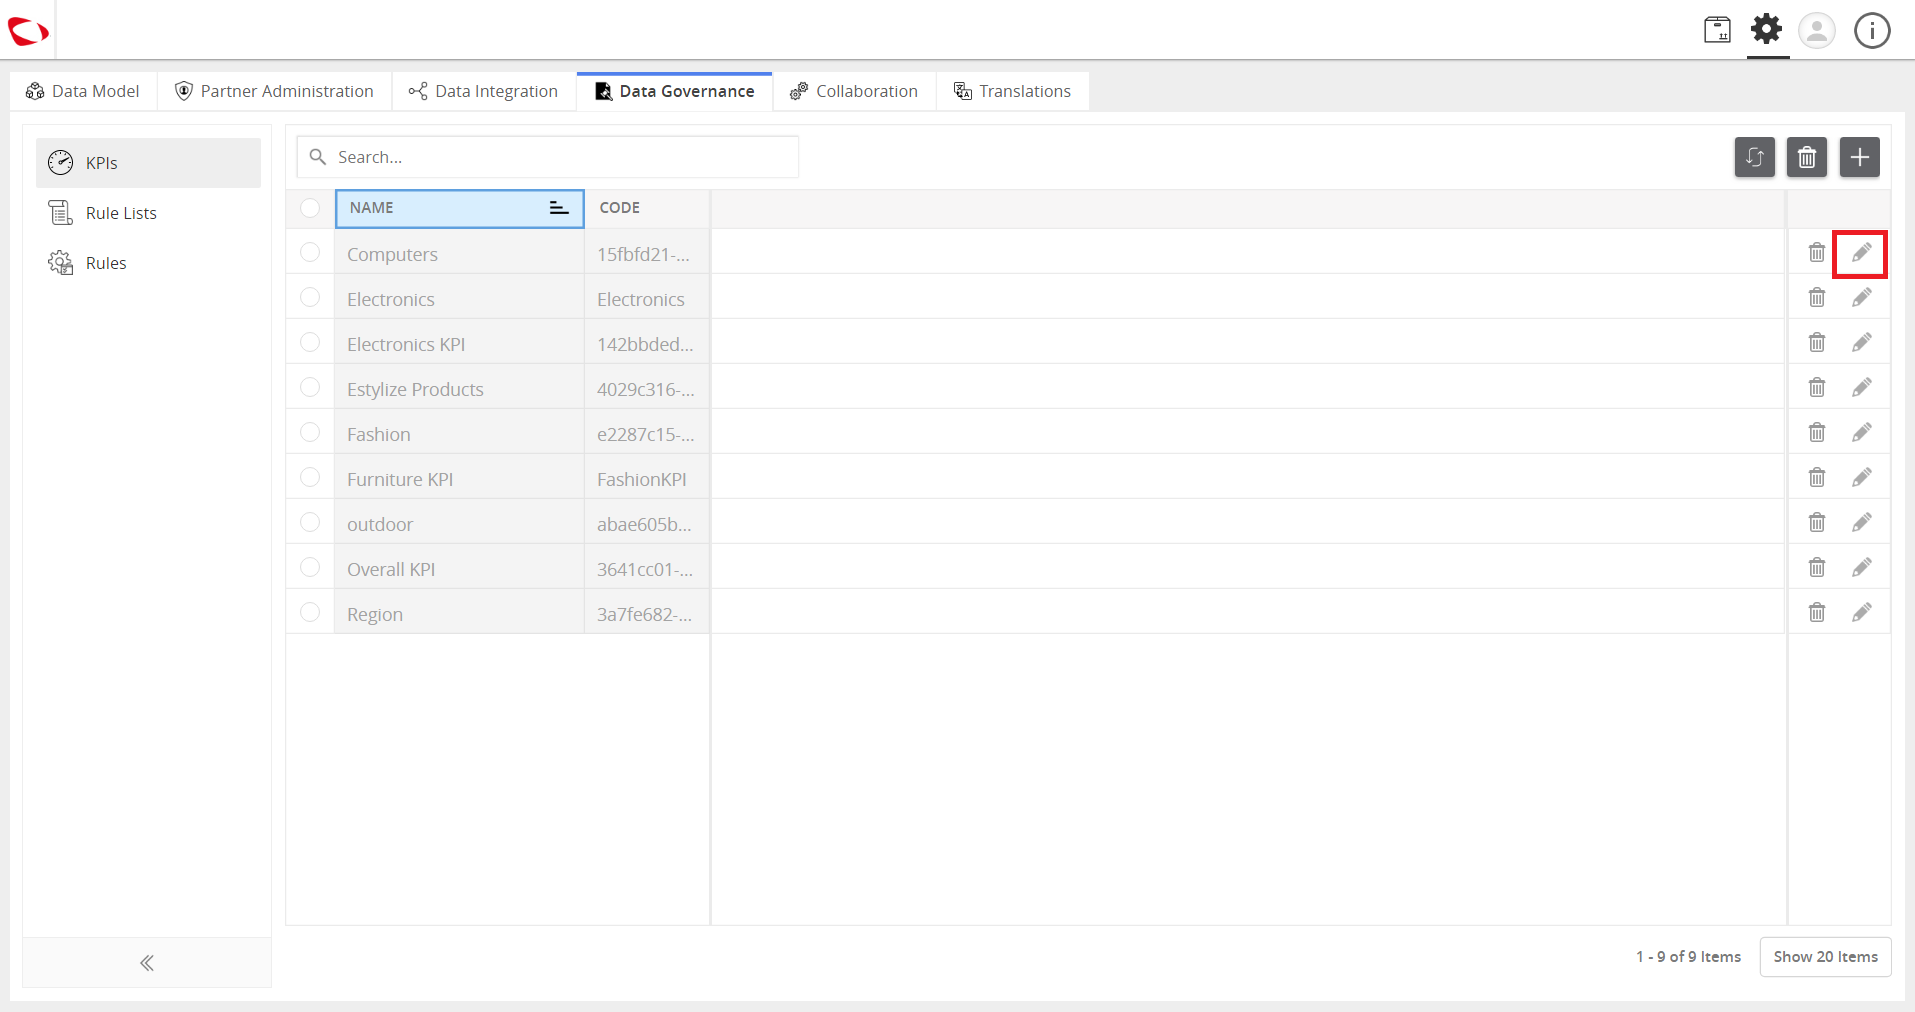
  1. Once the KPI is created, it appears in the list of KPI. Click the Edit icon.
../../../../../_images/cs_drilldownforkpireports_edit.PNG


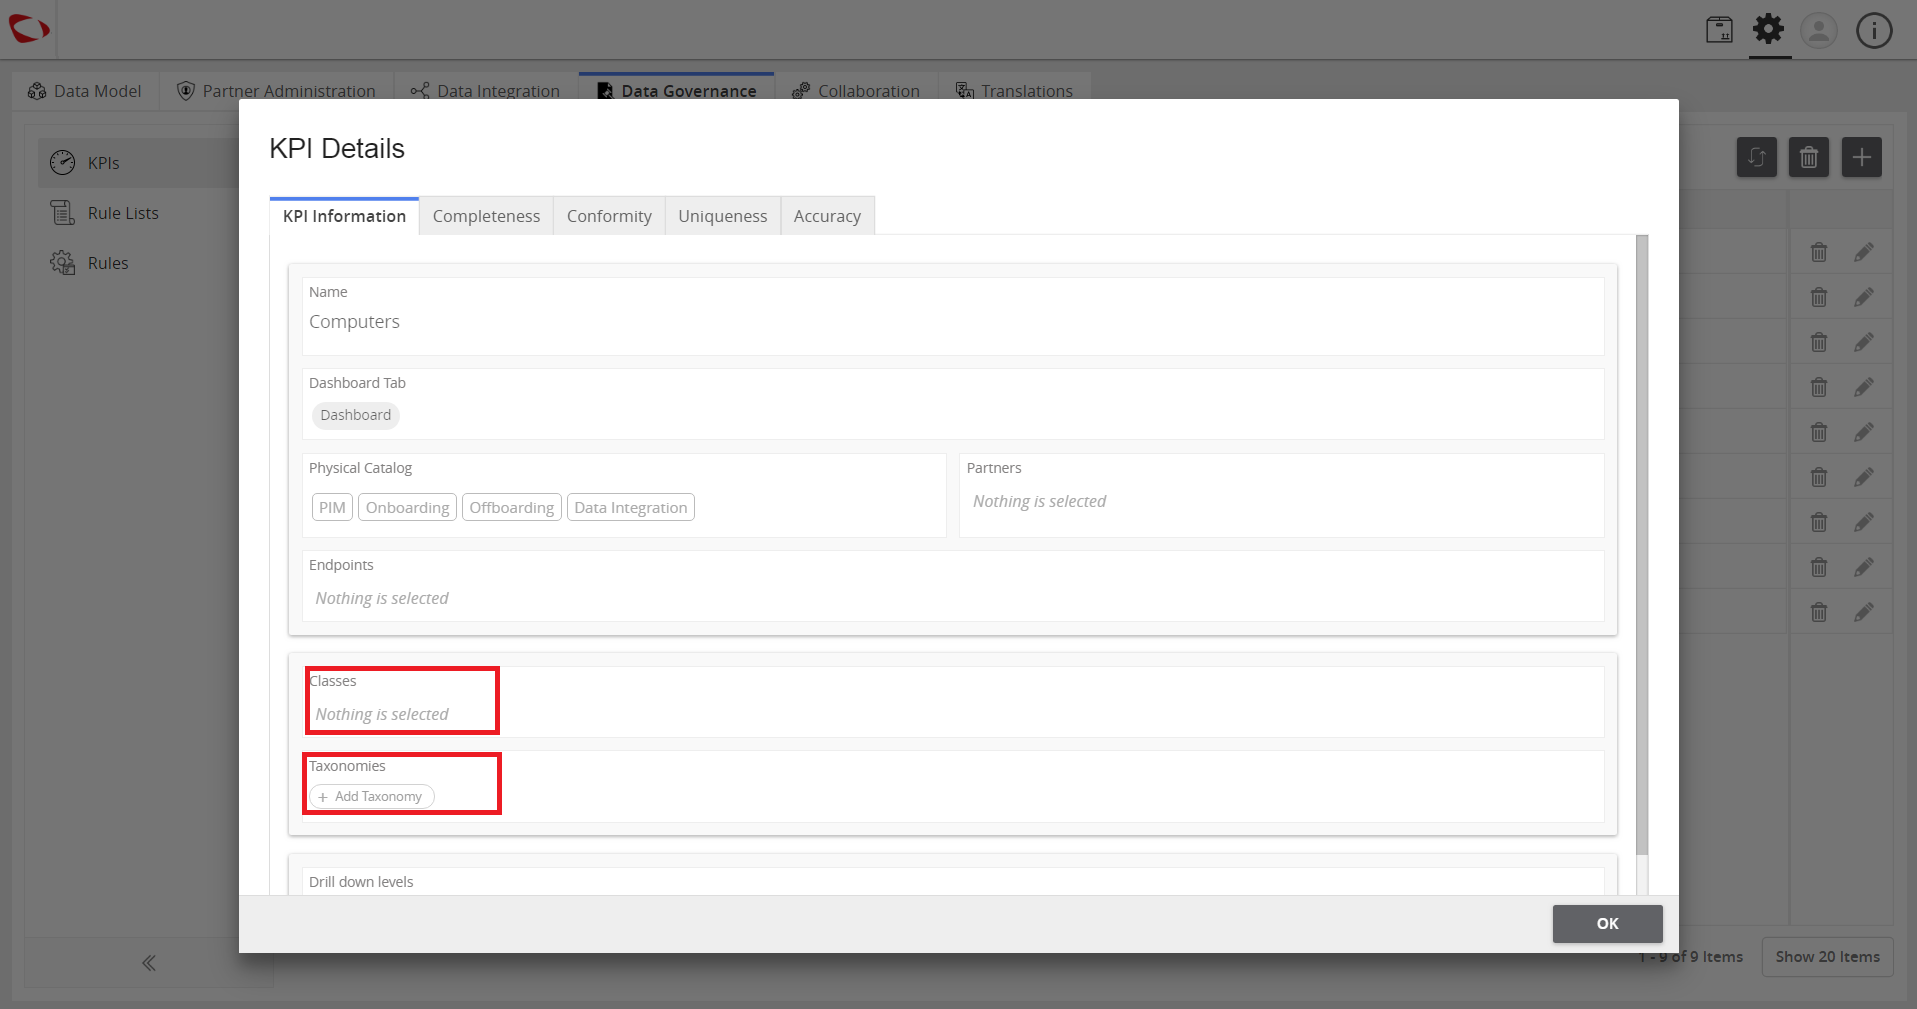
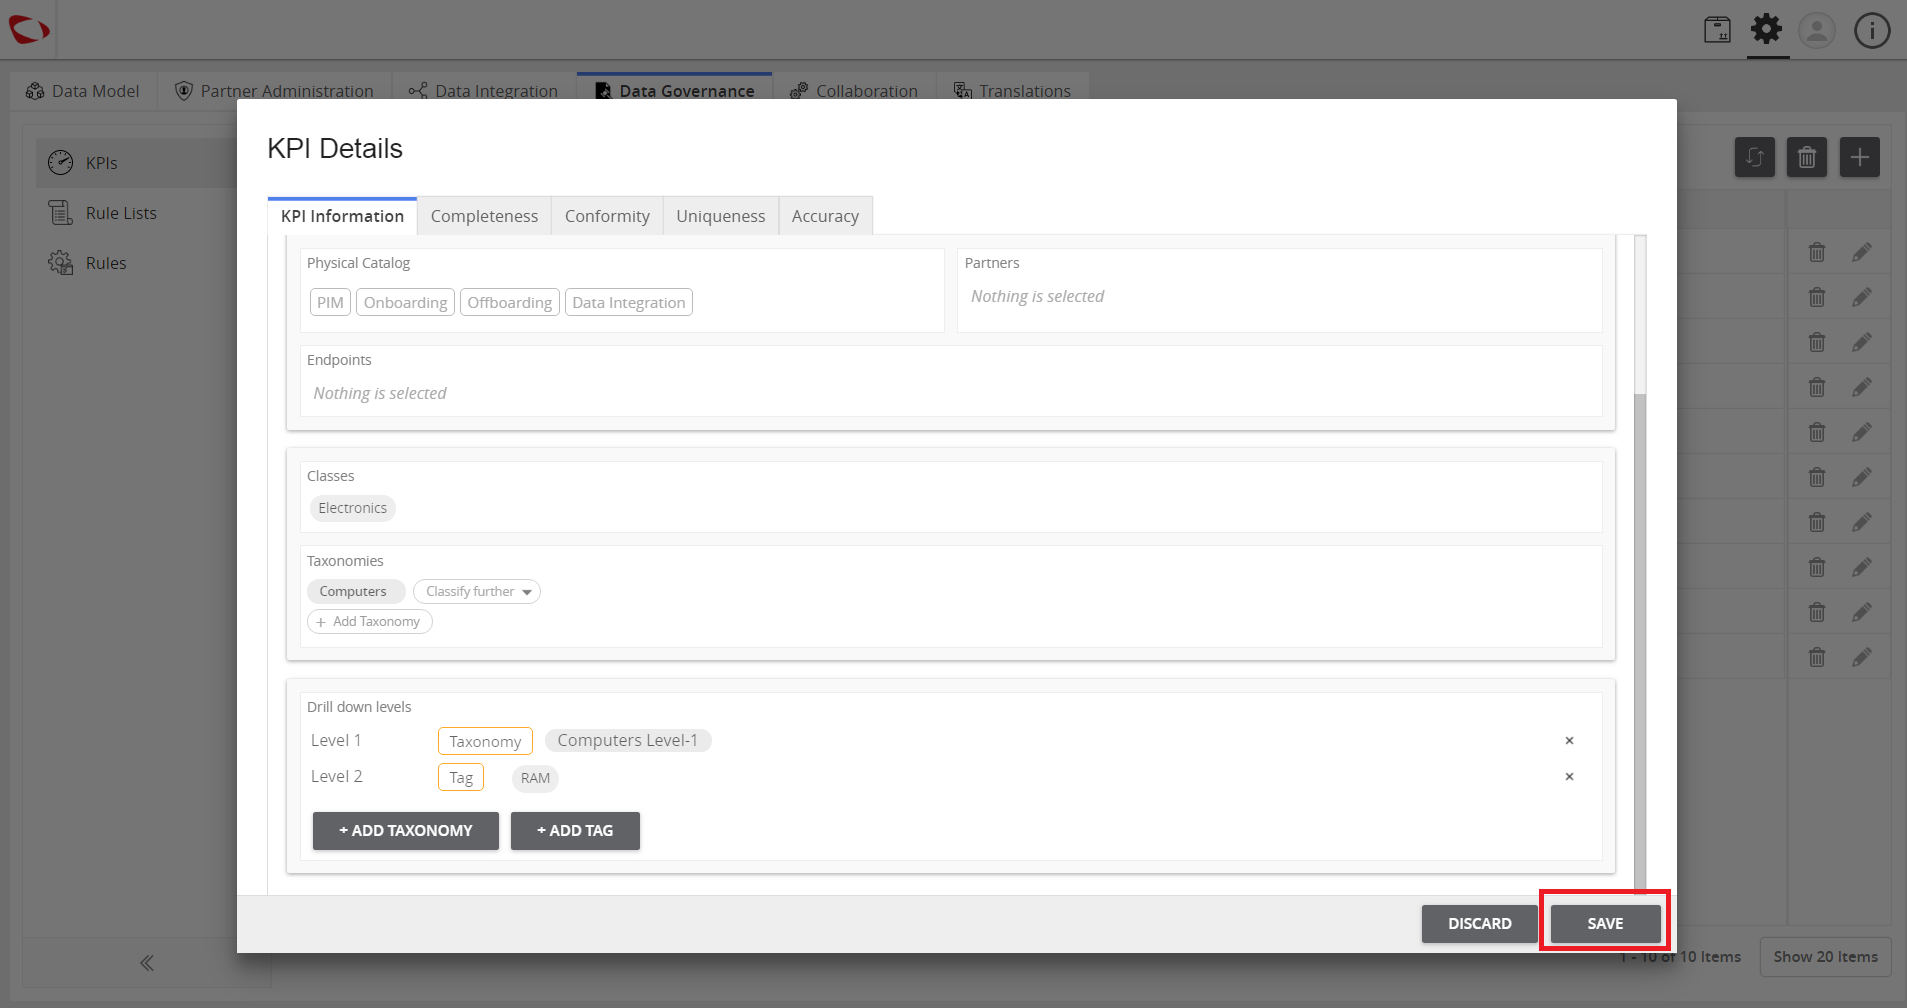
  1. On the KPI Information tab, click to select Class and Taxonomy.
../../../../../_images/cs_drilldownforkpireports_selclassandtax.PNG


  1. Add the tags or taxonomies in the selected KPI drilled down levels.
../../../../../_images/cs_drilldownforkpireports_addtaxtag.PNG


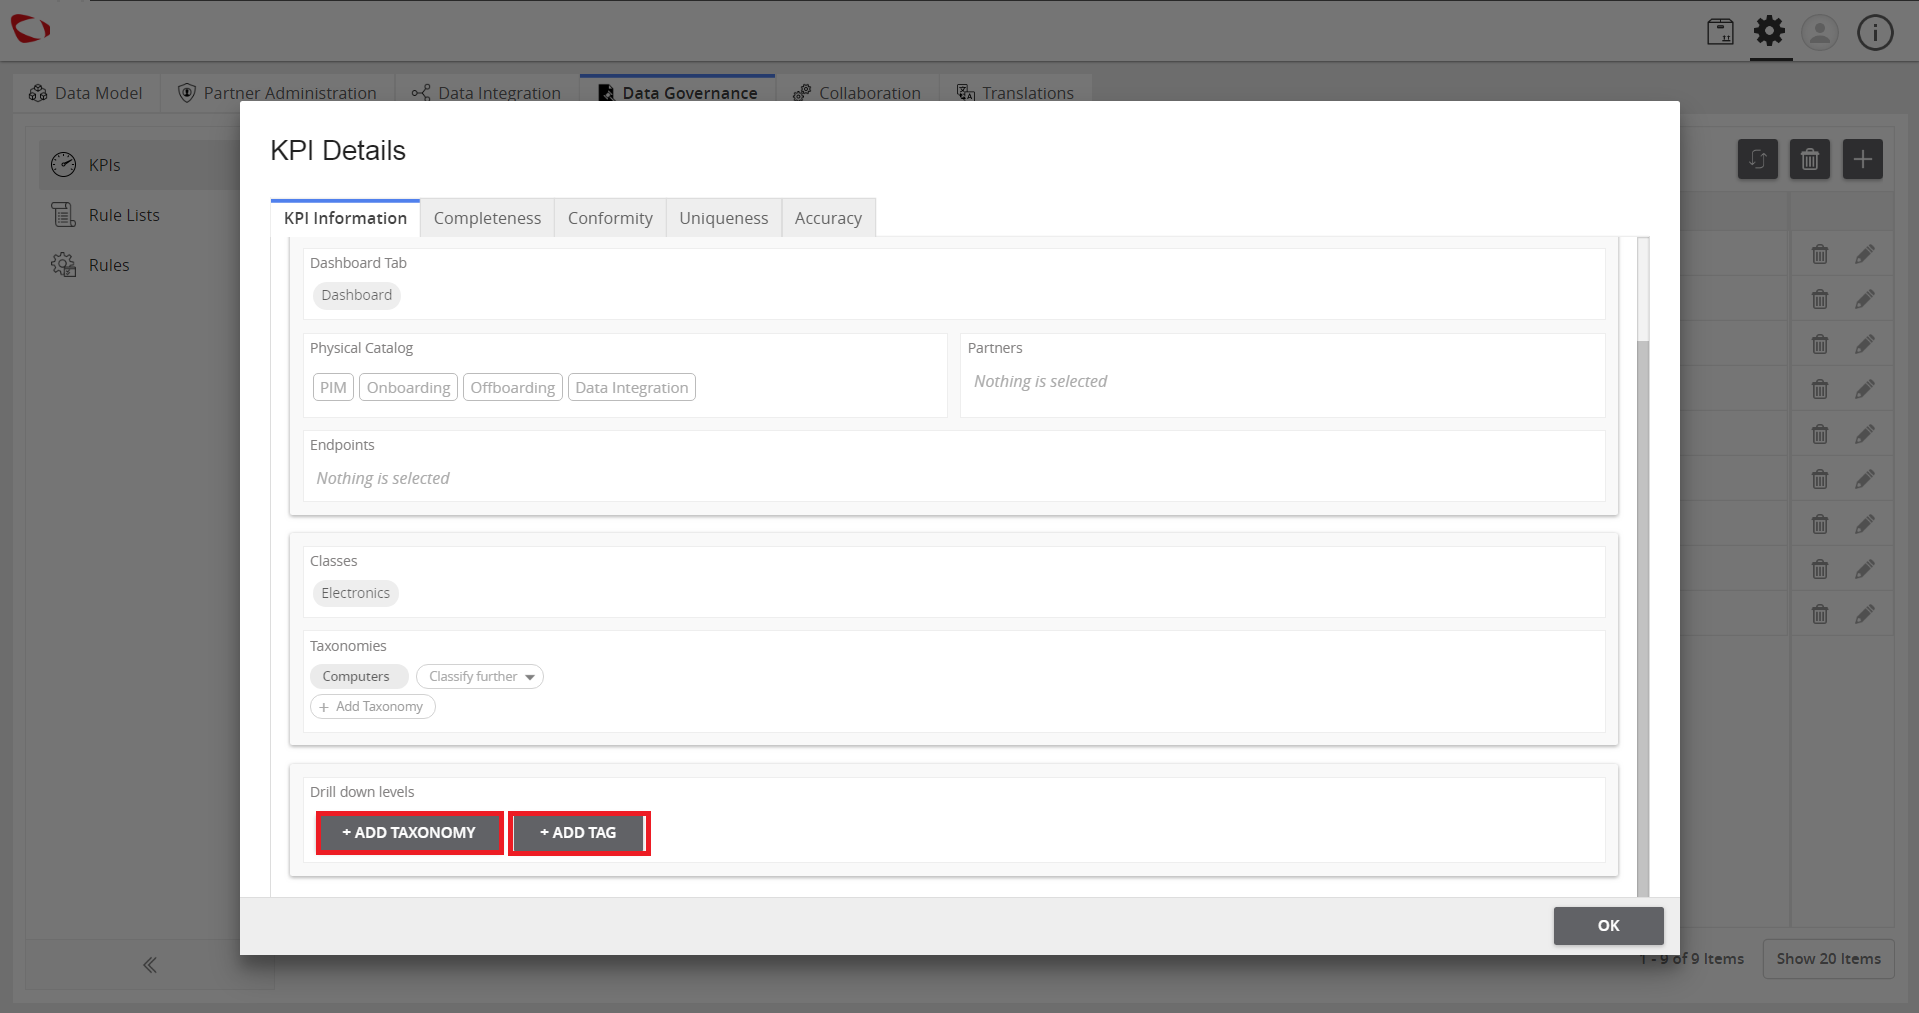
  1. Click SAVE to save the changes.
../../../../../_images/cs_drilldownforkpireports_clicksave.PNG


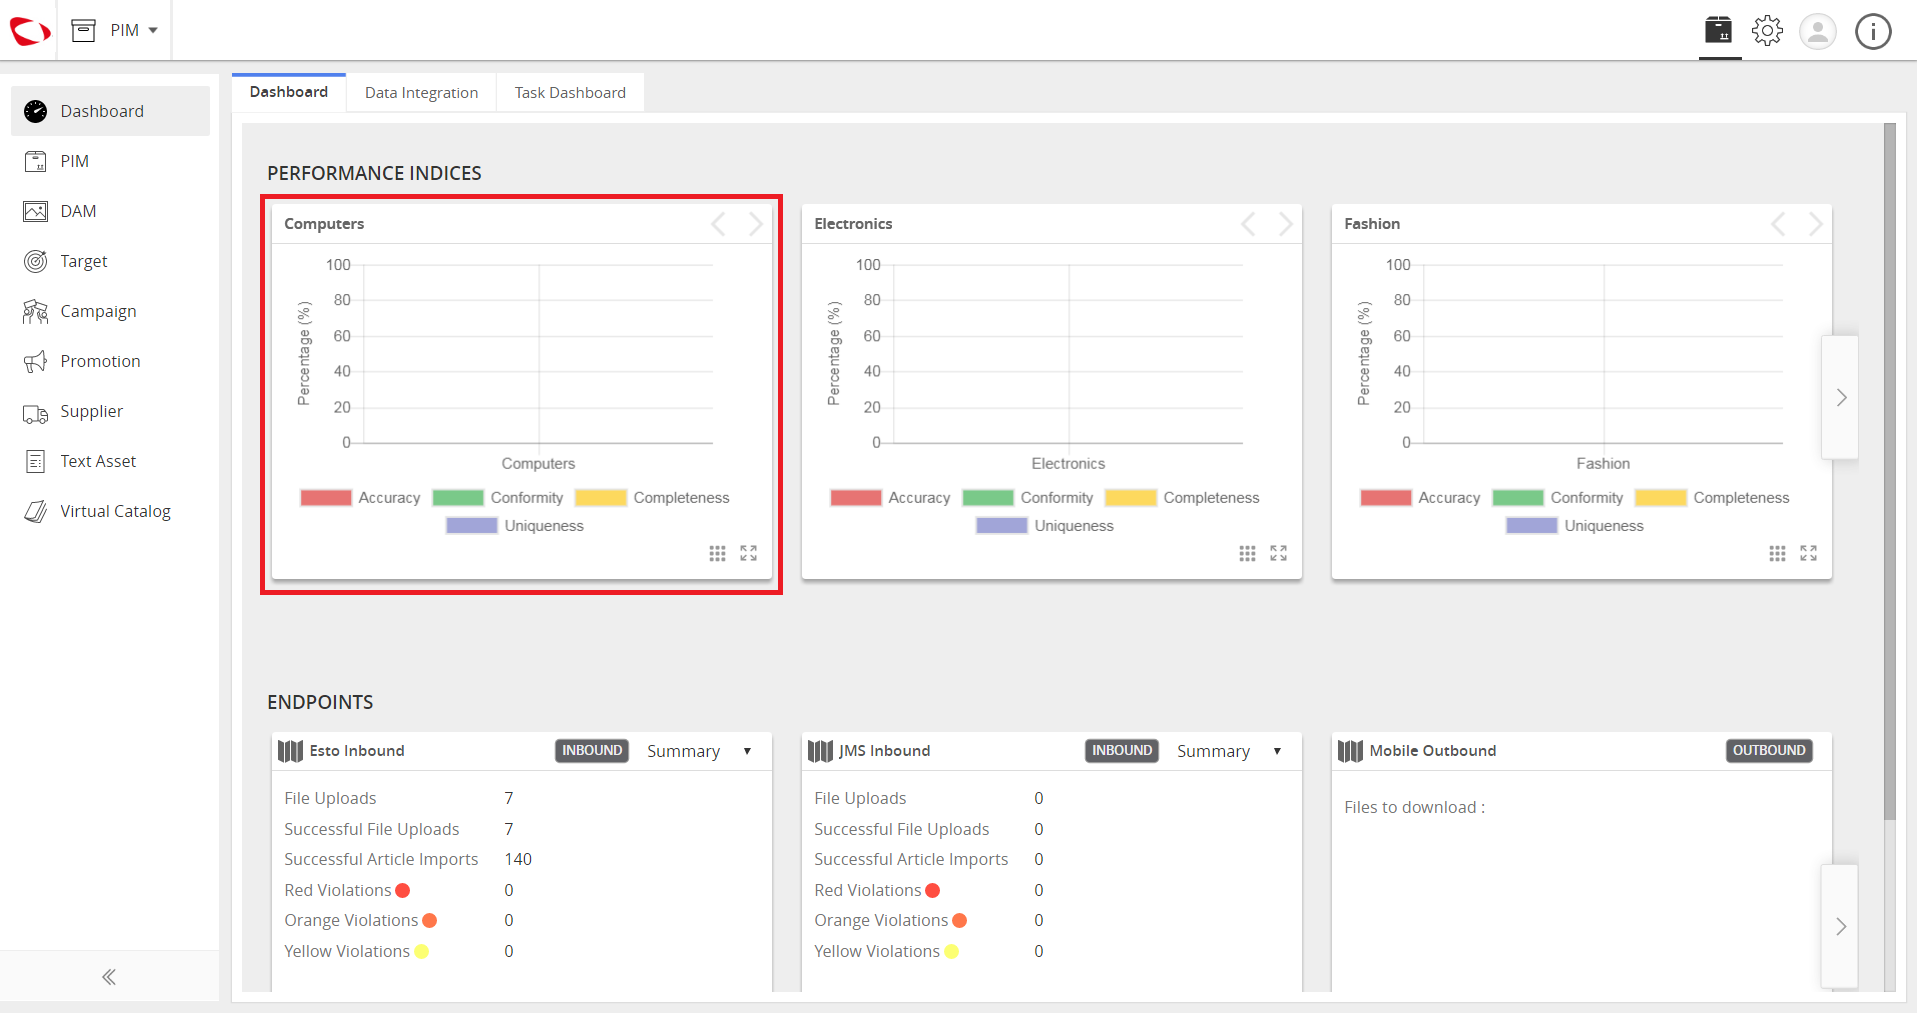
  1. Click Explore to go back to the dashboard.
../../../../../_images/cs_drilldownforkpireports_clickdash.PNG


  1. View the created dashboard. It drills down in the KPI, click on the graph bar and the KPI is drilled down with the appropriate taxonomy and tag.
../../../../../_images/cs_drilldownforkpireports_cviewkpi.PNG


Contentserv line

Last updated: Jul 27, 2018